
Back in 2015 I started building an MYP Megasheet of rubrics, subject-area overviews and other resources. Newly-added: some ATL tracking visualisations. There are some ideas for overall ATL development, as well as targeting a few specific skills and/or skills within each cluster.
Click here to have a look, and click here to make your own copy.
Some notes:
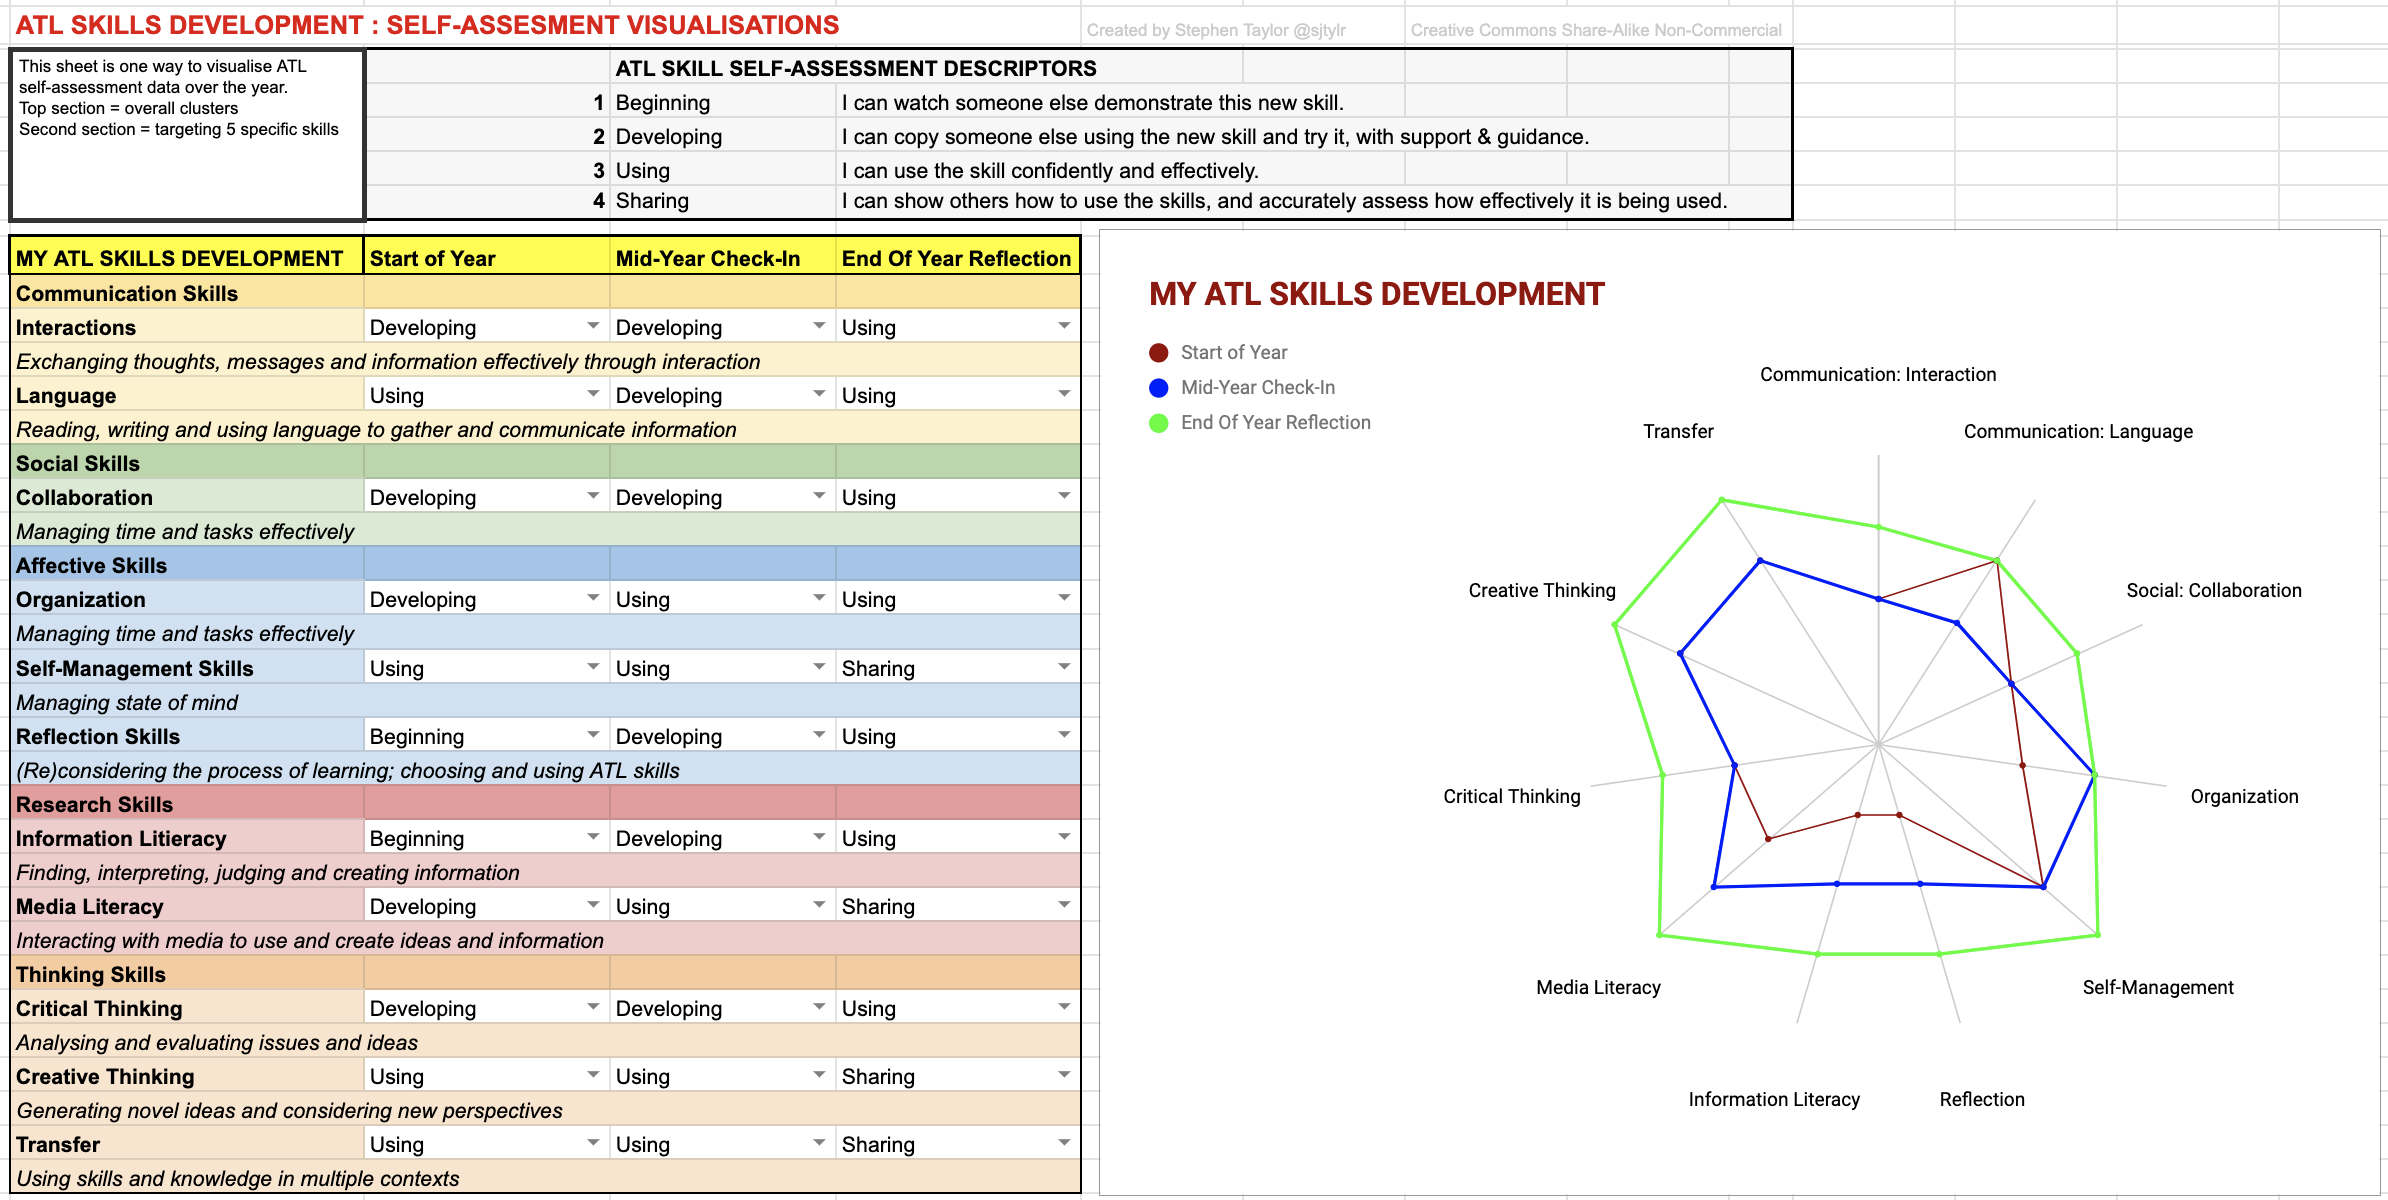
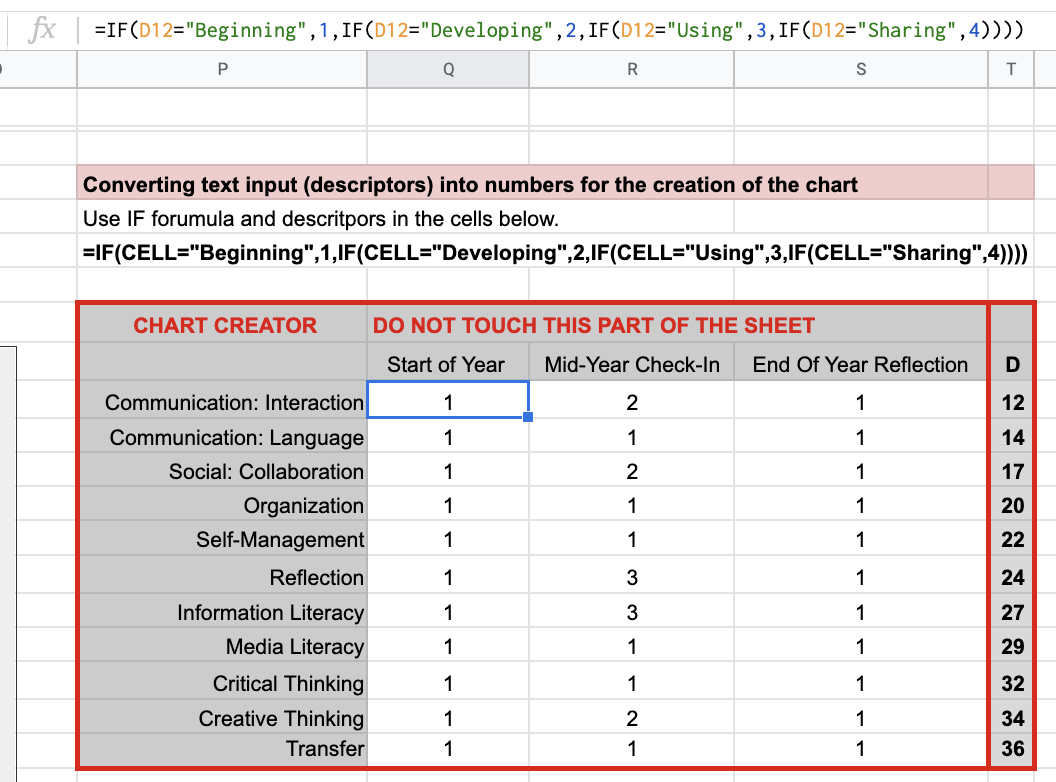
- I don’t like numbers connected to learning, especially with ATL. So… when the student selects the descriptor, there is another table that uses a complex IF formula* to generate 1-4 scale, so that the radar chart can be generated.
- I designed it as something for students, with teacher mentorship, rather than for teachers to ‘grade’ students’ ATLs.
One section of the sheet could be used for students’ target setting on ATL skills.

Radar Charts are Fab
I started working with radar/web charts as part of my MA studies in 2013, developing into a dissertation on The IMaGE Of An International School? Radar charts have a lot of potential to tell data stories, and you can see their application in tools such as the Mastery Transcript.
Developing Further
In the future I’ll have a go a making a classroom-focused data dashboard for ATL. For now, this is a toy to play with. Feel free to make your own copy and try it out.
*The IF Formula: a bit of a headmelter when it’s not simple TRUE/FALSE. Because the input table has interstitial lines to outline the ATL, it isn’t easily dragged-down, so I needed to type the source cell (D12 etc) each time. I’ll learn a better way eventually.

Thank-you for your comments.